Using Data to Improve Conversion
April 08, 2020
Increasing conversion by 170% by modifying loading screens.

Overview
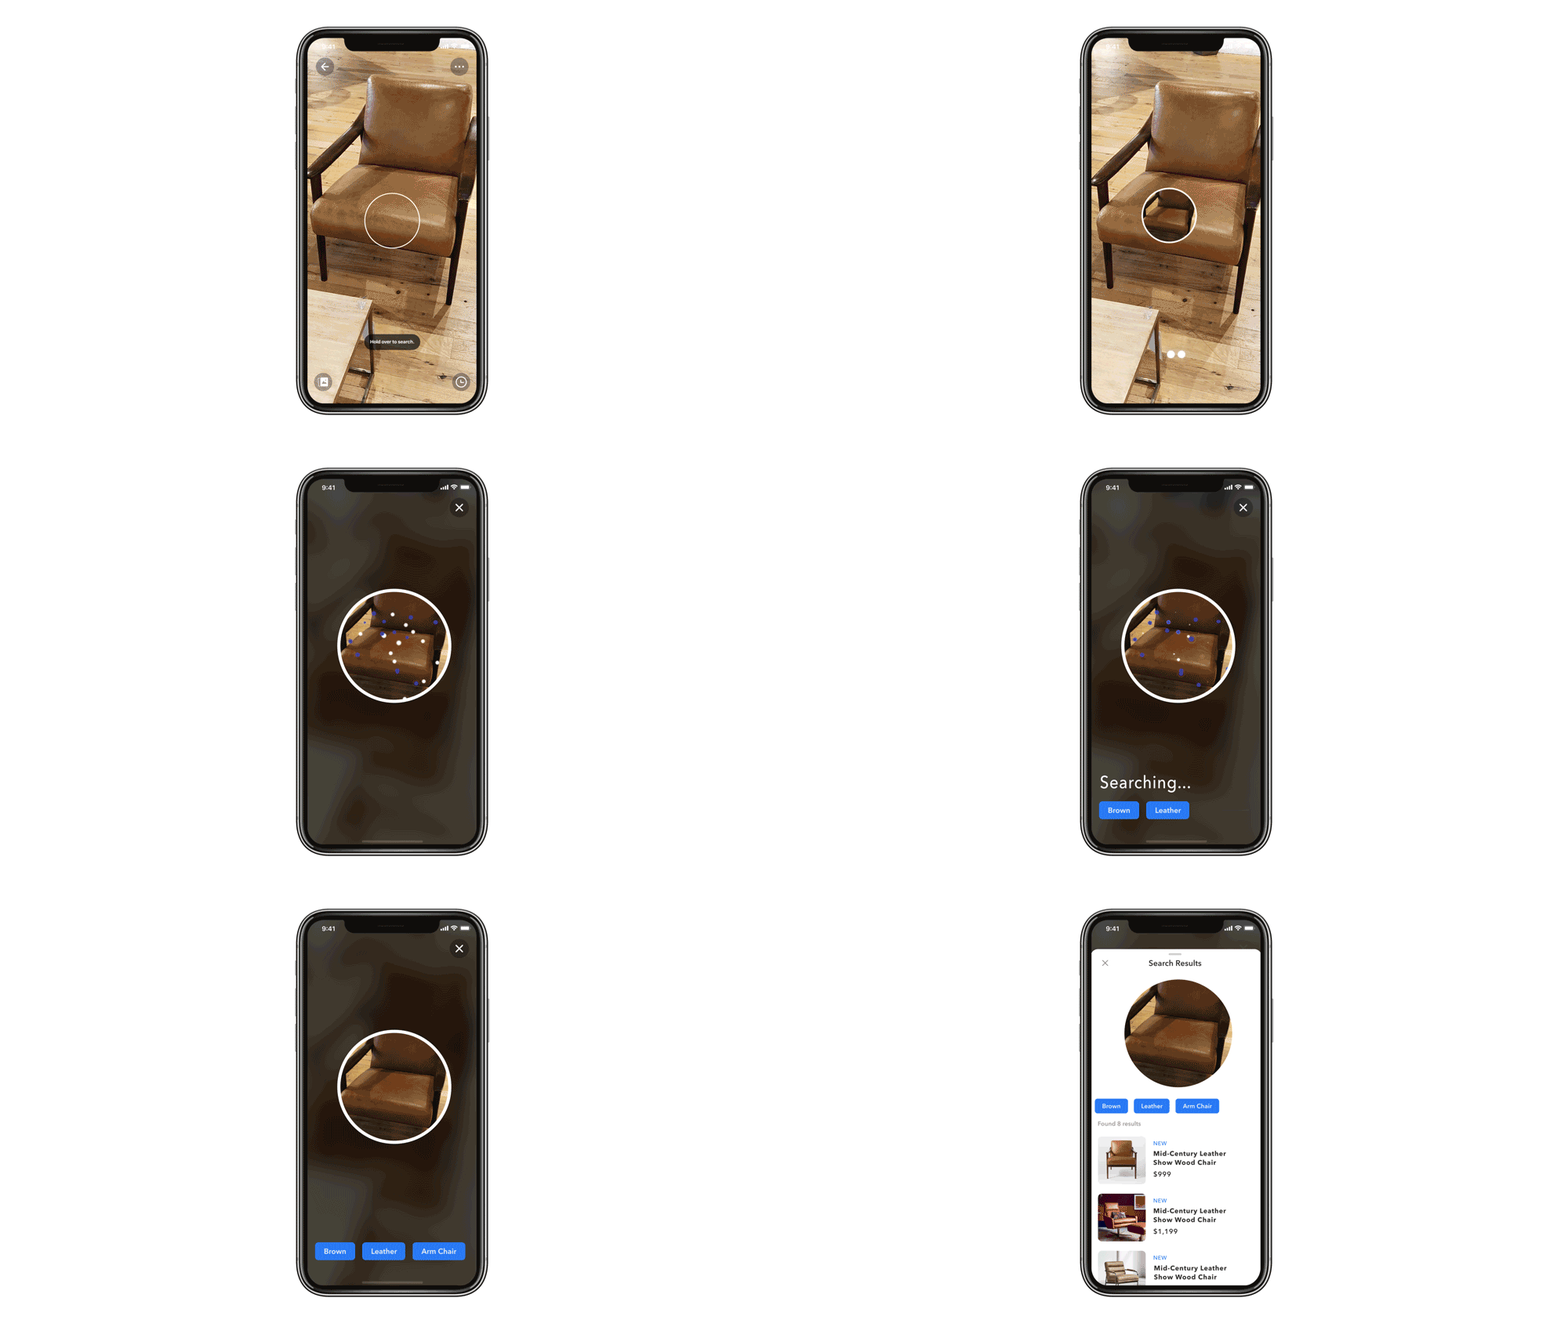
As a product manager, I’m always using data to inform decision-making. An instance that illustrates this was when I was the product manager for the visual search SDK used in several retail apps. Our SDK allowed users to snap a picture of any item and search for visually similar products the company sells.
The Problem
I created a dashboard in Google Data Studio, which pulled from our Google Big Query tables, to understand our conversion better. Our analytics showed that users were starting searches, but dropped off before the search finished. The conversion rate between users beginning a search and seeing the results was 30%. This conversion was the first step in the funnel and was not acceptable. We had to figure out a solution.
Limitations
Our team’s scope only included the mobile SDK and not the backend service that was providing the keywords or final results. A separate team was working on optimizing the service. We were limited to making changes in the UI to increase conversion.
Our Approach
With these limitations in mind, I decided to look into improving the loading experience. I researched how other companies were reducing the perceived load time in their applications, and lead our design and development teams in implementing the changes. We focused on three main areas:
Transition Timings
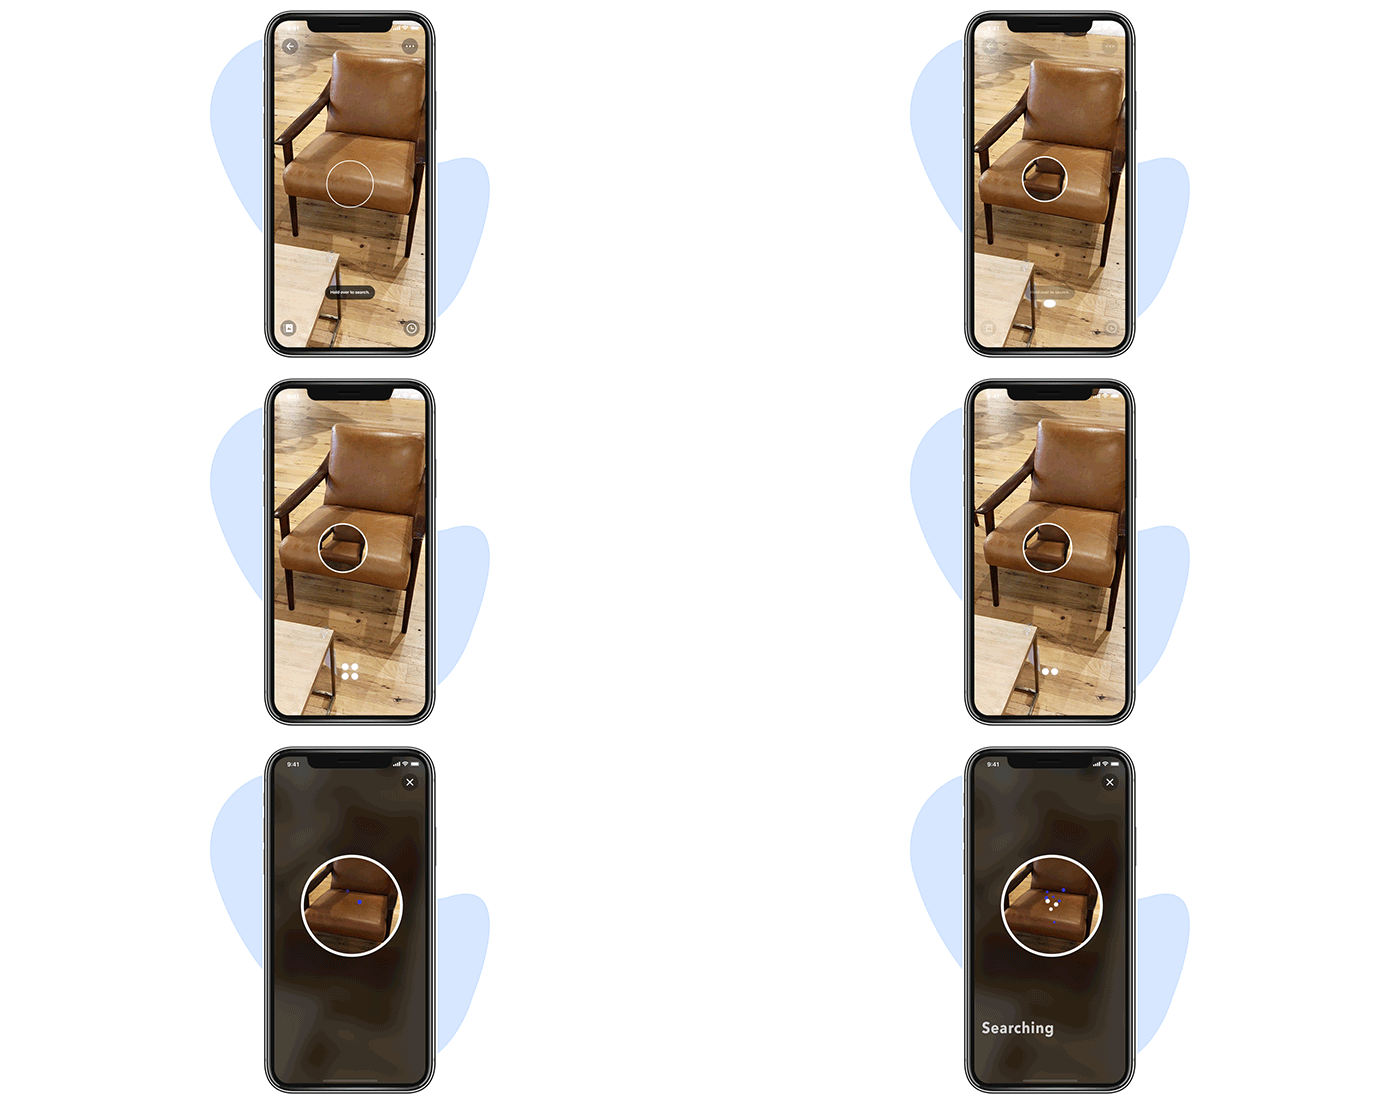
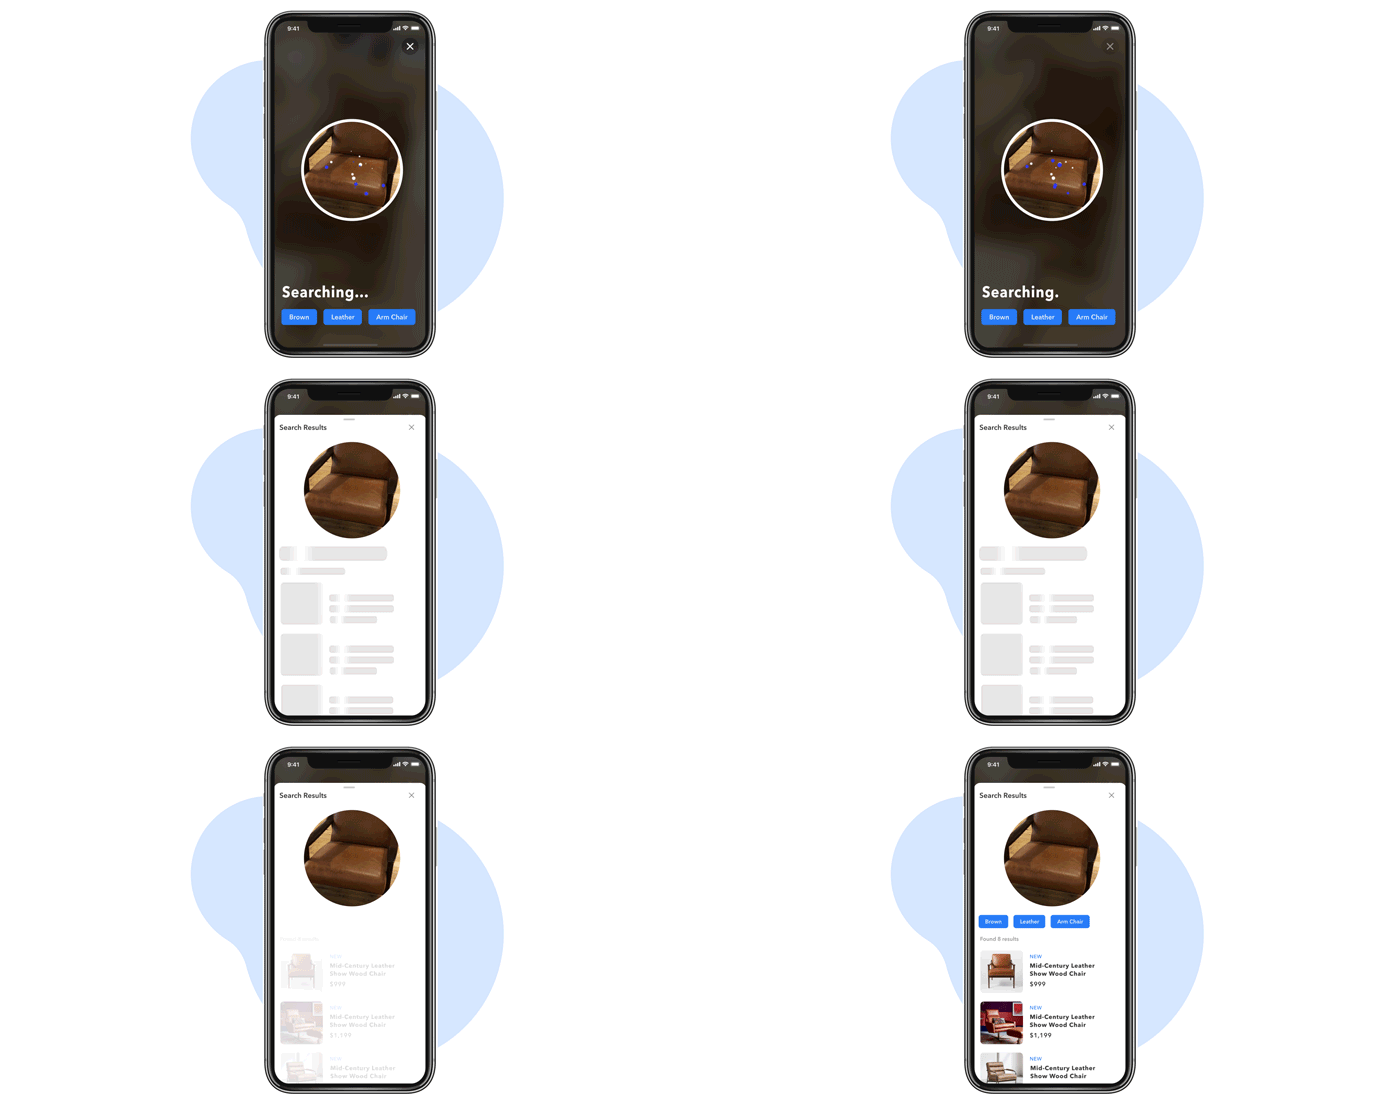
We smoothed out all of the animations and transitions to ensure that each state flowed smoothly into the next. In some cases, we added time to the transition, so the significant state changes were more evenly spaced.

Animations
We also introduced a detecting screen that would show small floating bubbles around the edges of the item the user tapped. This addition provided the user with a visual indication that processing is happening in the background.

Include Placeholder Content
On the product list page we included placeholder content for each product as including skeleton content is proven to reduced the percieved time.

Results
Once our clients integrated the latest version of our SDK, I was able to create a report comparing conversion. Since we tracked the version number of our SDK, I was able to create two segments based on the version numbers. The first segment was searches initiated on versions before the changes. The second segment was searches initiated on versions after we had made the change. When comparing the conversion, we saw a 170% increase, from 30% (left) to 80% (right), by only introducing user interface changes.

Above is a before (left) and after (right) of the chances live in a retail application.